1.4 Rock slope design methods
This section summarizes four different procedures for designing rock slopes, and shows the basic data that is required for analyzing slope stability. The design methods and the design data are common to both mining and civil engineering.

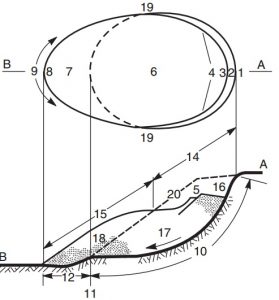
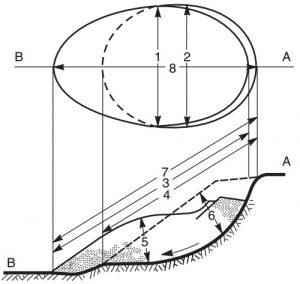
Tabel 1.1 Definition of landslides features
1.4.1 Summary of design methods
A basic feature of all slope design methods is that shear takes place along either a discrete sliding surface, or within a zone, behind the face. If the shear force (displacing force) is greater than the shear strength of the rock (resisting force) on this surface, then the slope will be unstable. Instability could take the form of displacement that may or may not be tolerable, or the slope may collapse either suddenly or progressively. The definition of instability will depend on the application. For example, an open pit slope may undergo several meters of displacement without effecting operations, while a slope supporting a bridge abutment would have little tolerance for movement. Also, a single rock fall from a slope above a highway may be of little consequence if there is an adequate ditch to contain the fall, but failure of a significant portion of the slope that reaches the traveled surface could have serious consequences.

Tabel 1.2 Definition of landslides dimensions
Based upon these concepts of slope stability, the stability of a slope can be expressed in one or
more of the following terms:
(a) Factor of safety, FS—Stability quantified by limit equilibrium of the slope, which is stable
if FS > 1.
(b) Strain—Failure defined by onset of strains great enough to prevent safe operation of the
slope, or that the rate of movement exceeds the rate of mining in an open pit.
(c) Probability of failure—Stability quantified by probability distribution of difference
between resisting and displacing forces, which are each expressed as probability distributions.
(d) LRFD (load and resistance factor design)—Stability defined by the factored resistance
being greater than or equal to the sum of the factored loads.

Tabel 1.3 Values of Minimum total safety
At this time (2003), the factor of safety is the most common method of slope design, and there is wide experience in its application to all types of geological conditions, for both rock and soil. Furthermore, there are generally accepted factor of safety values for slopes excavated for different purposes, which promotes the preparation of reasonably consistent designs. The ranges of minimum total factors of safety as proposed by Terzaghi and Peck (1967) and the Canadian Geotechnical Society (1992) are given in Table 1.3.
In Table 1.3, the upper values of the total factors of safety apply to usual loads and service conditions, while the lower values apply to maximum loads and the worst expected geological conditions. For open pit mines the factor of safety generally used is in the range of 1.2–1.4, using either limit equilibrium analysis to calculate directly the factor of safety, or numerical analysis
to calculate the onset of excessive strains in the slope.
Although probabilistic design methods for rock slopes were first developed in the 1970s (Harr, 1977; Canada DEMR, 1978), they are not widely used (as of 2003). A possible reason for this lack of acceptance is that terms such as “5% probability of failure” and “consequence of failure Principles of rock slope design 11 expressed as lives lost” are not well understood, and there is limited experience on acceptable probabilities to use in design (see Section 1.4.4).
The calculation of strain in slopes is the most recent advance in slope design. The technique has resulted from the development of numerical analysis methods, and particularly those that can incorporate discontinuities (Starfield and Cundall, 1988). It is most widely used in the mining field where movement is tolerated, and the slope contains a variety of geological conditions (see Chapter 10).
The load and resistance factor design method (LRFD) has been developed for structural design,
and is now being extended to geotechnical systems such as foundations and retaining structures.
Further details of this design method are discussed in Section 1.4.5.
The actual factor of safety, probability of failure or allowable strain that is used in design
should be appropriate for each site. The design process requires a considerable amount of judgment because of the variety of geological and construction factors that must be considered.
Conditions that would require the use of factors of safety at the high end of the ranges quoted in
Table 1.3 include the following:
• A limited drilling program that does not adequately sample conditions at the site, or
drill core in which there is extensive mechanical breakage or core loss.
• Absence of rock outcrops so that mapping of geological structure is not possible, and there
is no history of local stability conditions.
• Inability to obtain undisturbed samples for strength testing, or difficulty in extrapolating
laboratory test results to in situ conditions.
• Absence of information on ground water conditions, and significant seasonal fluctuations
in ground water levels.
• Uncertainty in failure mechanisms of the slope and the reliability of the analysis method.
For example, plane type failures can be analyzed with considerable confidence, while
the detailed mechanism of toppling failures is less well understood.
• Concern regarding the quality of construction, including materials, inspection and weather
conditions.
• The consequence of instability, with higher factors of safety being used for dams and
major transportation routes, and lower values for temporary structures or industrial roads
for logging and mining operations.
This book does not cover the use of rock mass rating systems (Haines and Terbrugge, 1991;
Durn and Douglas, 1999) for slope design. At this time (2003), it is considered that the frequent
influence of discrete discontinuities on stability should, and can be, incorporated directly into
stability analyses. In the rock mass rating, the geological structure is only one component of the rating and may not be given an appropriate weight in the rating.
A vital aspect of all rock slope design is the quality of the blasting used in excavation. Design
assumes that the rock mass comprises intact blocks, the shape and size of which are defined by
naturally occurring discontinuities. Furthermore, the properties of these discontinuities should be predictable from observations of surface outcrops and drill core. However, if excessively heavy blasting is used which results in damage to the rock behind the face, stability could be dependent on the condition of the fractured rock. Since the properties of the fractured rock are unpredictable, stability conditions will also be unpredictable. Blasting and the control of blast damage are discussed in Chapter 11.
1.4.2 Limit equilibrium analysis (deterministic)
The stability of rock slopes for the geological conditions shown in Figure 1.4(a) and (f) depends on the shear strength generated along the sliding surface.

Figure 1.8 Method of calculating factor of safety of sliding block: (a) Mohr diagram showing shear strength defined by cohesion c and friction angle φ; (b) resolution of force W due to weight of block into components parallel and perpendicular to sliding plane (dip ψp).
For all shear type failures, the rock can be assumed to be a Mohr–Coulomb material in which the shear strength is expressed in terms of the cohesion c and friction angle φ. For a sliding surface on which there is an effective normal stress σ� acting, the shear strength τ developed on this surface is given by
τ = c + σ� tan φ (1.1)
Equation (1.1) is expressed as a straight line on a normal stress—shear stress plot (Figure 1.8(a)),
in which the cohesion is defined by the intercept on the shear stress axis, and the friction angle is
defined by the slope of the line. The effective normal stress is the difference between the stress due to the weight of the rock lying above the sliding plane and the uplift due to any water pressure
acting on this surface. Figure 1.8(b) shows a slope containing a continuous joint dipping out of the face and forming a sliding block. Calculation of the factor of safety for the block shown in Figure 1.8(b) involves the resolution of the force acting on the sliding surface into components acting perpendicular and parallel to this surface. That is, if the dip of the sliding surface is ψp, its area is A, and the weight of the block lying above the sliding surface is W, then the normal and shear stresses on the sliding plane are
Normal stress : σ = W cos ψp/A
and shear stress : τs = W sin ψp/A (1.2)
and equation (1.1) can be expressed as
τ = c + (W cos ψp tan φ)/A (1.3)
or
τsA = W sin ψp and
τA = cA + W cos ψp tan φ (1.4)
In equations (1.4), the term [W sin ψp] defines the resultant force acting down the sliding plane
and is termed the “driving force” (τsA), while the term [cA + W cos ψp tan φ] defines the shear
strength forces acting up the plane that resist sliding and are termed the “resisting forces” (τA).
The stability of the block in Figure 1.8(b) can be quantified by the ratio of the resisting and driving forces, which is termed the factor of safety, FS. Therefore, the expression for the factor of
safety is
FS = resisting forces/driving forces (1.5)
FS = (cA + W cos ψp tan φ)/(W sin ψp) (1.6)
The displacing shear stress τs and the resisting shear stress τ defined by equations (1.4) are plotted on Figure 1.8(a). On Figure 1.8(a) it is shown that the resisting stress exceeds the displacing stress, so the factor of safety is greater than one and the slope is stable.
If the sliding surface is clean and contains no infilling then the cohesion is likely to be zero and equation (1.6) reduces to
FS = (cos ψp · tan φ)/sin ψp (1.7)
or
FS = 1 when ψp = φ (1.8)
Equations (1.7) and (1.8) show that for a dry, clean surface with no support installed, the block
of rock will slide when the dip angle of the sliding surface equals the friction angle of this surface,
and that stability is independent of the size of the sliding block. That is, the block is at a condition
of “limiting equilibrium” when the driving forces are exactly equal to the resisting forces and the
factor of safety is equal to 1.0. Therefore, the method of slope stability analysis described in this
section is termed limit equilibrium analysis.

Figure 1.9 The effect of ground water and bolt forces on factor of safety of rock slope: (a) ground water and bolting forces acting on sliding surface; (b) Mohr diagram of stresses acting on sliding surface showing stable and unstable stability conditions.
Limit equilibrium analysis can be applied to a wide range of conditions and can incorporate forces such as water forces acting on the sliding surface, as well as external reinforcing forces supplied by tensioned rock anchors. Figure 1.9(a) shows a slope containing a sliding surface with area A and dip ψp, and a vertical tension crack. The slope is partially saturated such that the tension crack is half-filled with water, and the water table exits where the sliding surface daylights on the slope face. The water pressures that are generated in the tension crack and on the sliding surface can be approximated by triangular force diagrams where the maximum pressure, p at the base of the tension crack and the upper end of the sliding surface is given by
p = γw hw (1.9)
where γw is the unit weight of water and hw is the vertical height of water in the tension crack.
Based on this assumption, the water forces acting in the tension crack, V , and on the sliding plane, U, are as follows:
V =1/2.γw.h2w and U = 1/2.γw.hwA (1.10)
and the factor of safety of the slope is calculated by modifying equation (1.6) as follows:
FS = cA + (W cos ψp − U − V sin ψp) tan φ / (W sin ψp + V cos ψp) (1.11)
Similarly, an equation can be developed for a reinforced slope in which a tensioned rock anchor has been installed with the anchor below the sliding plane. If the tension in the anchor is T and it is installed at an angle ψT below the horizontal, then the normal and shear forces acting on the sliding plane due to the anchor tension are respectively:
NT = T sin(ψT + ψp) and
ST = T cos(ψT + ψp) (1.12)
and the equation defining the factor of safety of the anchored, partially saturated slope is
FS = cA + (W cos ψp − U − V sin ψp + T sin(ψT + ψp)) tan φ/(W sin ψp + V cos ψp − T cos(ψT + ψp))
(1.13)
Figure 1.9(b) shows on a Mohr diagram the magnitude of the normal and shear stresses on
the sliding surface developed by the water and bolting forces, and their influence on the factor
of safety. That is, destabilizing forces (e.g. water) decrease the normal stress and increase the shear stress, and tend to cause the resultant of the forces to be above the limiting strength line, indicating instability (Point B). In contrast, stabilizing forces (bolting and drainage) increase the normal stress and decrease the shear stress, and cause the resultant to be below the line, indicating stability (Point C).
The force diagram in Figure 1.9(b) can also be used to show that the optimum dip angle for the
bolts, that is, the dip that produces the greatest factor of safety for a given rock anchor force is
ψT(opt) = �φ − ψp� or φ = ψp + ψT(opt) (1.14)
Strict application of equation (1.14) may show that the anchor should be installed above the
horizontal, that is, ψT is negative. However, in practice, it is usually preferable to install anchors below the horizontal because this facilitates drilling and grouting, and provides a more reliable installation.
These examples of limit equilibrium analysis to calculate the stability of rock slopes show that this is a versatile method that can be applied to a wide range of conditions. One limitation of the limit equilibrium method is that all the forces are assumed to act through the center of gravity of the block, and that no moments are generated.
This analysis described in this section is applicable to a block sliding on a plane. However, under certain geometric conditions the block may topple rather than slide, in which case a different form of limit equilibrium analysis must be used. Figure 1.10 shows the conditions that differentiate stable, sliding and toppling blocks in relation to the width �x and height y of the block, the dip ψp of the plane on which it lies and the friction angle φ of this surface. Sliding blocks are analyzed either as plane or wedge failures (see Chapters 6 and 7 respectively), while the analysis of toppling failures is discussed in Chapter 9. Figure 1.10(b) shows that there are only limited conditions under which toppling occurs, and in fact this is a less common type of failure compared with sliding failures.
References : Wyllie, Duncan C. And Mah, Christopher W (2004) Rock slope engineering – civil and mining 4th edition, London and New York